Thin-layer chromatography (TLC)
- Thin Layer Chromatography (TLC) is a powerful analytical technique used for the separation and identification of compounds in a mixture. It is widely employed in various fields such as pharmaceuticals, forensics, environmental analysis, and biochemistry.
- TLC provides a quick and efficient method to assess the progress of a reaction, analyze the purity of compounds, and determine the components of a mixture.
- The foundation of TLC lies in the principle of chromatography, which involves the separation of compounds based on their differential affinity for a stationary phase and a mobile phase.
- In TLC, the stationary phase is a thin layer of an adsorbent material, typically silica gel or alumina, which is spread uniformly on a solid support such as a glass plate or a plastic sheet. This layer serves as the stationary phase onto which the sample mixture is applied.
Basic of Thin Layer Chromatography:
- The TLC plate, consisting of the adsorbent material, acts as a solid support for the separation process. Silica gel is a common adsorbent used in TLC due to its high surface area and polarity. The adsorbent is typically mixed with a binder such as gypsum or cellulose to ensure adherence to the plate. The resulting mixture is then spread evenly onto the plate to form a thin, uniform layer.
- The separation in TLC is achieved by the differential migration of compounds through the stationary phase when subjected to a mobile phase.
- The mobile phase is a solvent or a mixture of solvents that moves up the plate through capillary action. The choice of a suitable solvent mixture is crucial for effective separation. The solvent mixture should have the ability to dissolve the sample components and carry them up the plate at different rates, depending on their affinity for the stationary phase.
- Ethyl acetate is a commonly used polar solvent in TLC due to its moderate polarity and compatibility with a wide range of compounds. It is often used in combination with other solvents to create a solvent system that provides optimal separation. The polarity of the solvent system can be adjusted by varying the ratio of different solvents to achieve the desired separation.
- When a TLC plate is developed, the solvent system is carefully chosen and poured into a developing chamber. The plate is then placed vertically into the chamber, allowing the solvent to rise up the plate by capillary action. As the solvent travels up the plate, it carries the sample components along with it. The distance traveled by the solvent is referred to as the solvent front.
- The separation of compounds on a TLC plate is visualized using various detection methods, including ultraviolet (UV) light. UV light is commonly used as it can reveal compounds that absorb UV radiation, making them visible as distinct spots on the plate. These spots correspond to individual compounds in the sample mixture.
- The distance traveled by each compound from the point of application is dependent on its affinity for the stationary phase and the mobile phase.
- Polar compounds have a higher affinity for the stationary phase and tend to move more slowly, resulting in shorter migration distances. Less polar compounds, on the other hand, have a higher affinity for the mobile phase and travel further up the plate.
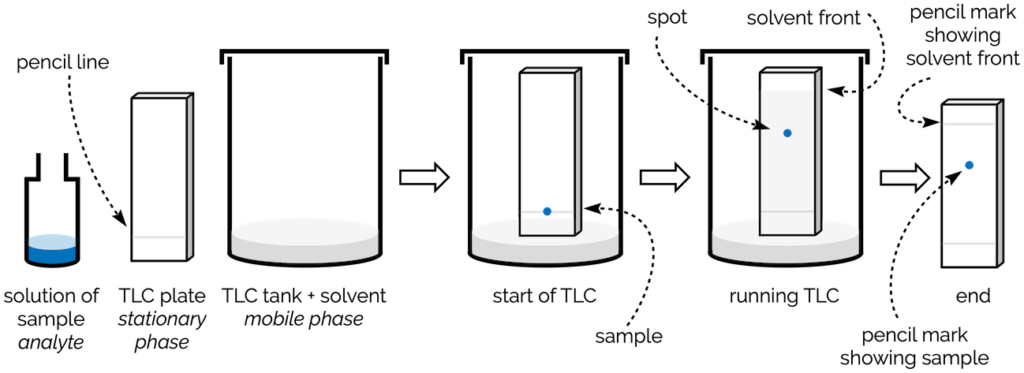
The Basic procedure for classical Thin Layer Chromatography steps:
- To perform TLC, the following steps are typically followed:
- Preparation of the TLC plate: The stationary phase, such as silica gel or alumina, is mixed with a binder and spread evenly on a solid support, usually a glass plate or a plastic sheet. The plate is then dried and activated, if required, by heating.
- Application of the sample: The sample mixture or individual compounds are spotted onto the TLC plate using a capillary tube or a microsyringe. Multiple samples or different concentrations can be applied side by side or in separate lanes. A spot or zone of the sample solution is applied to the plate origin.
- Selection of the mobile phase: The appropriate solvent system is chosen based on the polarity of the compounds to be separated. The solvent system is poured into a developing chamber, ensuring that the depth of the solvent is below the origin line where the sample is applied.
- Development of the TLC plate: The TLC plate is carefully placed into the developing chamber, ensuring that the sample spots are above the solvent level. On the plate, the sample solvent is allowed to evaporate. The solvent then ascends up the plate, carrying the compounds along with it. The development is stopped when the solvent front reaches the desired distance from the origin line.
- By means of capillary action, the mobile phase rises through the applied location. Up till the solvent front is 10-15 cm beyond the origin, development is ongoing.
- Visualization of the separated compounds: After development, the TLC plate is removed from the chamber and either air drying or heating the plate removes the mobile phase.
- The separated compounds on the plate can be visualized using various techniques such as UV light, iodine vapor, or specific staining reagents depending on the nature of the compounds.
- If the chemicals are not fluorescent or naturally coloured, a detection reagent is used to make the zones visible.
- Analysis and interpretation of results: The distance traveled by the solvent front (Rf value or retention factor) and the appearance of spots on the TLC plate are noted. The Rf values can be compared to reference values for identification purposes, and the spots can be quantitatively analyzed if required.
- TLC is often used as a preliminary technique to assess the progress of a reaction. By comparing the TLC profiles of reactants and products at different time points, researchers can monitor the conversion of starting materials to desired products or the formation of intermediates. This information can guide further optimization or modification of reaction conditions.
- In summary, thin layer chromatography (TLC) is a versatile analytical technique that allows for the separation and identification of compounds in a mixture.
- By utilizing a stationary phase, such as silica gel, and a mobile phase, such as a polar solvent system, TLC enables the visualization and analysis of compound separation on a thin layer. With its simplicity, speed, and cost-effectiveness, TLC serves as a valuable tool in various scientific disciplines for qualitative analysis, progress monitoring of reactions, and initial compound characterization.
Preparation of the Plate prior to “Spotting”
- To prevent fingerprints from being left on the plate, only the top of the plate should be lightly scribbled with a pencil.
- To prevent introducing extraneous substances into the sorbent’s active surface, it is a good idea to handle plates while wearing disposable plastic gloves.
- Prior to usage, the plate is prewashed up to the top in the developing solvent or a 1:1 solution of chloroform and methanol. This will remove any unnecessary material from the layer.
- This method is especially suggested for quantitative operations when a high contrast between the zone and background is necessary for precise and sensitive scanning as well as when chemicals of interest may travel at or near the solvent front during the development procedure.
- Without prior cleaning, plates may have a significant amount of superfluous material at or near the solvent front.
- Placing pre-coated plates in an oven at 70°C to 110°C for 30 minutes before spotting will activate them if they have been exposed to excessive humidity or have been on hand for a long time.
- To ascertain whether prewashing and activation processes are required for a certain separation, trial and error will be required.
- For HPTLC, the origin line is typically 1.5–2.5 cm from the plate’s bottom.
- The effectiveness of the chromatography is significantly influenced by the distance between the mobile-phase entrance location and the origin line, with 10 mm being ideal for Thin Layer Chromatography and 6 mm for High-performance thin-layer chromatography (HPTLC) (Cserhati and Forgacs, Year-1996)
- Using a template or spotting guide, which is readily available from numerous manufacturers, you can mark the origin line and the solvent front line with a soft pencil; however, you must take care to avoid destroying the layer.
- In order to compare RF values, spots should be applied in a straight horizontal line. A line parallel to the origin and between 10 and 15 cm from the origin is used to indicate the solvent front (5-7 cm for HPTLC).
- When RF values are to be determined, a solvent front distance of 10 cm is practical.
The mobile phase selection in TLC:
A. The Elutropic Series:
- For adsorption chromatography, solvents can be categorised into a so called elutropic series based on the strength of their elution.
- Table shows that the semiempirical parameter e° measures the solvent strength, which rises with solvent polarity (ability to form hydrogen bonds).
- Although the figures in the table are for alumina, silica gel can also be utilised with reasonable reliability, despite differences in relative strengths between different adsorbents.
- For example,
- More basic solvents are usually stronger when used with acidic silica or alumina.
- Acidic solvents are stronger with amino-bonded silica as the adsorbent.
- In addition to elution strength considerations, solvents with low boiling points, low viscosities, low toxicity and flammability, nonreactivity toward the layer and sample components, low cost, and suitable solubility characteristics are preferred for creating mobile phases.
- These solvents will help with evaporation from the layer, development time, and spot diffusion.
- Solvents from the elutropic series are mixed at the proper concentration in binary or ternary mixes to create TLC mobile phases.
- In most cases, the strength of a solvent mixture will be intermediate between the strengths of the two (or more) components of the mixture.
- To accomplish the necessary separation, the mobile phase must also have the right strength and selectivity.
| Solvent | semiempirical parameter (e°) | Solvent | semiempirical parameter (e°) |
| Fluoroalkanes | -0.25 | Methyl chloride | 0.42 |
| n-Pentane | 0 | Ethylene dichloride | 0.44 |
| Isooctane | 0.01 | Methyl ethyl ketone | 0.51 |
| Petroleum ether | 0.01 | 1-Nitropropane | 0.53 |
| n-Decane | 0.04 | Triethylamine | 0.54 |
| Cyclohexane | 0.04 | Acetone | 0.56 |
| Cyclopentane | 0.05 | Dioxane | 0.56 |
| 1 -Pentene | 0.08 | Tetrahydrofuran | 0.57 |
| Carbon disulfide | 0.15 | Ethyl acetate | 0.58 |
| Carbon tetracholoride | 0.18 | Methyl acetate | 0.6 |
| Xylene | 0.26 | Diethylamine | 0.63 |
| /-Propyl ether | 0.28 | Nitromethane | 0.64 |
| i-Propyl chloride | 0.29 | Acetonitrile | 0.65 |
| Toluene | 0.29 | Pyridine | 0.71 |
| n-Propyl chloride | 0.3 | Dimethyl sulfoxide | 0.75 |
| Benzene | 0.32 | /- or n-Propanol | 0.82 |
| Ethyl bromide | 0.35 | Ethanol | 0.88 |
| Ethyl sulfide | 0.38 | Methanol | 0.95 |
| Chloroform | 0.4 | Ethylene glycol | 1.1 |
B. Designing a Separation on Silica Gel
- Silica gel is generally used layer for normal-phase TLC, but others comprise alumina and polar-bonded silica phases such as cyano, amino, and diol.
C. Designing a Partition Separation
- Mobile phases in reversed-phase TLC typically consist of water and an organic modifier.
- Solvent strength increases as concentration rises and modifier polarity decreases.
- The empirical solvent strength parameter S can be utilised as a gauge of solvent strength for separations on reversed-phase chemically linked C18 layers.
| Solvent | S |
| Water | 0 |
| Methanol | 3 |
| Acetonitrile | 3.1 |
| Dioxane | 3.1 |
| Ethanol | 3.6 |
| Isopropanol | 4.2 |
| Tetrahydrofuran | 4.4 |
A Comparison of Conventional Thin layer chromatography and High-Performance Thin Layer Chromatography
| Parameter | Conventional TLC | HPTLC |
| Plate size (cm) | 20 X 20 | 10 X 10 |
| —— | —– | 10 X 20 |
| Particle size (µm) | —– | —– |
| Average | 20 | 5-15 |
| Distribution | 10-60 | Tight |
| Adsorbent layer thickness (µm) | 100-250 | 200 |
| Plate height (µm) | 30 | 5-20 |
| Total number of usable theoretical plates | < 600 | < 5000 |
| Separation number | 7-10 | 10-20 |
| Sample volume (µl) | 1-5 | 0.01-0.2 |
| Starting spot diameter (mm) | 3-6 | 1-2 |
| Diameter of separated spots (mm) | 6-15 | 2-6 |
| Solvent migration distance (cm) | 10-15 | 3-6 |
| Separation time (min) | 30-200 | 3-20 |
| Detection limits (ng) | —– | —– |
| Absorption | 1-5 | 0.1-0.5 |
| Fluorescence | 0.05-0.1 | 0.005-0.01 |
| Samples per plate | 10 | 18-36 |
Book:
- Thin-Layer Chromatography Fourth Edition, Revised and Expanded Bernard Fried & Joseph Sherma
- Lloyd R. Snyder, Joseph J. Kirkland, Joseph L. Glajch – Practical HPLC Method Development, 2nd Edition (1997)