Validation of Analytical Procedures or Method Validation (ICH Q2(R1))
What are the Parameters covered in Analytical Method Validation (AMV)?
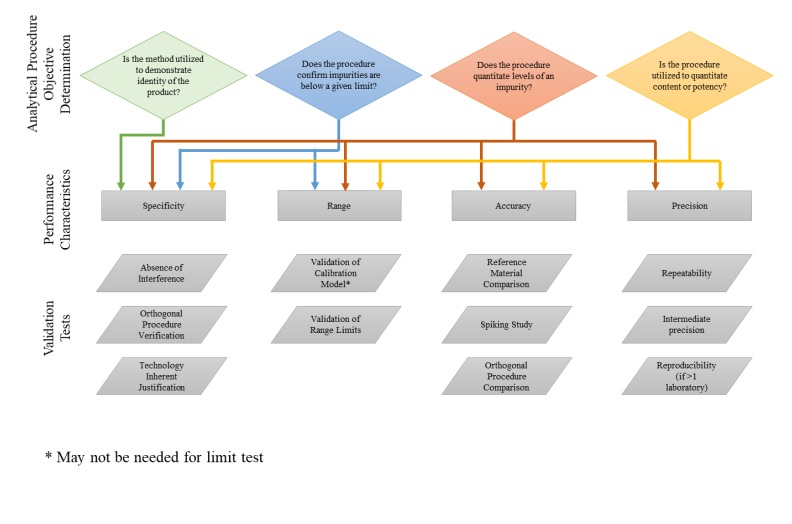
As per ICH Q2 (R1):
- Accuracy (Recovery)
- Precision – A. Repeatability, B- Intermediate Precision (Robustness)
- Specificity
- Linearity
- Range
- Ruggedness
- Solution Stability
When the Method Re-Validation required ?
- Synthesis of the drug substance (API);
- Composition of the finished product (FP);
- Analytical procedure & method.
- Analytical instruments (shift from one method to another). (Ex. HPLC to UV or UPLC method).
ICH Q2 (R1):Analytical Method Validation (AMV) or Validation of Analytical Procedures in Details:
1. SPECIFICITY:
It is the ability to measure unequivocally the analyte in the presence of components that may be expected to be present.
Impurities, degradants, matrix, and other substances are common examples.
- Injections (Sample, Placebo, and Impurities matrix) shall be injected.
- Peak of interest should not be interfered by placebo or any other peak.
- Peak Purity or Deconvolution has been observed in routine validation by use of PDA Detector.
2. ACCURACY or RECOVERY:
- The accuracy of an analytical procedure expresses the closeness of agreement between the value which is accepted either as a conventional true value or an accepted reference value and the value found.
- The analytical procedure’s accuracy should be established over the required range.
- Placebo + spike of Impurity/Sample/Drug Substance: with 3 each level Injection RSD shall be checked
- Accuracy should be measured using a minimum of 9 determinations or samples over a minimum of 3 concentration levels containing the specified range (e.g., 3 replicates of different 3 concentrations of the total analytical procedures).
2. PRECISION:
- The precision of an analytical procedure explained the closeness of agreement (degree of scatter) between a series of measurements obtained from multiple sampling (in the same homogeneous sample) under the prescribed conditions.
A. Repeatability: 6 Injection short interval of time (same day, same instrument) and RSD shall be checked.
- a) a min. of 9 determinations (Analysis) covering the specified range for the procedure (e.g., 3 concentrations/3 replicates each); or
- b) a min. of 6 determinations (Analysis) at 100% of the test concentration or final concentration.
B. Intermediate Precision or Robustness: Intermediate precision explained by
- Within-laboratories variations:
- Different days,
- Various analysts,
- Different equipment, etc. (6 Injection %RSD shall be checked)
Reproducibility: Reproducibility expresses the precision between laboratories.
3. DETECTION LIMIT (LOD):
- Based on Visual Evaluation: The detection limit is determined by the analysis of samples with known concentrations of analyte and by establishing the minimum level at which the analyte can be reliably detected.
- Based on Signal-to-Noise: A signal-to-noise ratio between 3 or 2:1 is generally considered acceptable for estimating the detection limit.
- Use of the Standard Deviation of the Response and the Slope
The detection limit (DL) can be written as:
DL = 3.3 σ /S
Where,
- σ = the standard deviation of the response
- S = the slope of the calibration curve. The slope “S” shall be calculated from the calibration curve of the analyte
- C.1: Based on the Standard Deviation of the Blank: Measurement of the degree of analytical background response is accomplished by analyzing a suitable number of blank samples and calculating the standard deviation (SD) of these responses.
- C.2: Based on the Calibration Curve : A specific calibration curve should be studied using samples containing an analyte in the range of detection limit (DL). The residual standard deviation of a regression line or the standard deviation (SD) of y-intercepts of regression lines may be used as the standard deviation (SD).
4. QUANTITATION LIMIT (LOQ):
- Based on Visual Evaluation: The quantitation limit is generally determined by the analysis of samples with known concentrations of analyte and by establishing the minimum level at which the analyte can be quantified with acceptable accuracy and precision.
- Based on Signal-to-Noise Approach: Determination of the signal-to-noise ratio is performed by comparing measured signals from samples with known low concentrations of analyte with those of blank samples and by determining the analyte’s minimal concentration at which it can be accurately measured. A typical signal-to-noise ratio is 10:1.
- Use of the Standard Deviation of the Response and the Slope
The quantitation limit (QL) can be written as:
QL = 10 σ /S
Where,
- σ = the standard deviation of the response
- S = the slope of the calibration curve.
The slope S may be calculated or estimated from the calibration curve of the analyte.
The estimate of σ may be calculated in a variety of ways for example:
- C.1 Based on Standard Deviation of the Blank: Measurement of the magnitude of analytical background response is performed by analyzing an appropriate number of blank samples and calculating the standard deviation of these responses.
- C.2 Based on the Calibration Curve: A specific calibration curve should be studied using samples, containing an analyte in the range of quantitation limit (QL). The residual standard deviation of a regression line or the standard deviation of y-intercepts of regression lines may be used as the standard deviation.
5. LINEARITY:
A linear relationship should be evaluated across the range of the analytical procedure.
- For the establishment of linearity, a minimum of 5 concentrations is recommended.
- The correlation coefficient, y-intercept, slope of the regression line, and residual sum of squares should be calculated for submission.
- Normally covered between: 50% to 150% of target Concentration.
6.RANGE:
The specified range is normally derived from linearity studies and depends on the intended application of the procedure.
The following min. specified ranges should be considered:
- For the assay of a drug substance or a finished (drug) product: normally from 80 to 120 percent of the test concentration;
- Content uniformity (CU), covering a minimum of 70 to 130 percent of the test concentration, unless a wider more appropriate range, based on the nature of the dosage form (e.g., metered dose inhalers), is justified;
- For dissolution testing: +/-20 % over the specified range; e.g., if the specifications for a controlled released product cover a region from 20%, after 1 hour, up to 90%, after 24 hours, the validated range would be 0-110% of the label claim.
- For the determination of an impurity: from the reporting level of an impurity1 to 120% of the specification;
- The detection/quantitation limit for impurities known to be extremely powerful or to generate hazardous or unexpected pharmacological effects should be comparable with the level at which the impurities must be managed;
- If assay and purity are performed together as one test and only a 100% standard is used, linearity should cover the range from the reporting level of the impurities1 to 120% of the assay specification.
7.ROBUSTNESS:
It is a measure of method’s capacity to remain unaffected by small, but deliberate (purposefully) variations in method parameters and provides an indication of its reliability (Consistency) during normal usage.
Parameter to be checked:
- Stability of analytical solutions;
- Extraction time.
- In the case of HPLC
- Influence of variations of pH in a mobile phase;
- Influence of variations in mobile phase composition;
- Different HPLC columns (different lots and/or suppliers);
- Temperature;
- Flow rate.
- In the case of gas-chromatography, examples of typical variables are:
- Different GC columns (different lots and/or suppliers);
- Temperature;
- Flow rate.
Solution Stability used in Analytical Method Validation (AMV):
Solution kept at 1. 2-8°C & Normal Room Temperature
- RSD shall be checked both solution by SST and Bracketing (BKT).
ICH Q2 (R1) & ICH Q2 (R2)- Revision under Draft:
Related Read: